Flight Path Explorer


Partnered with Airbus's innovation center to explore flight path variations and estimate the cost due to weather and delays.
Making the case for weather data
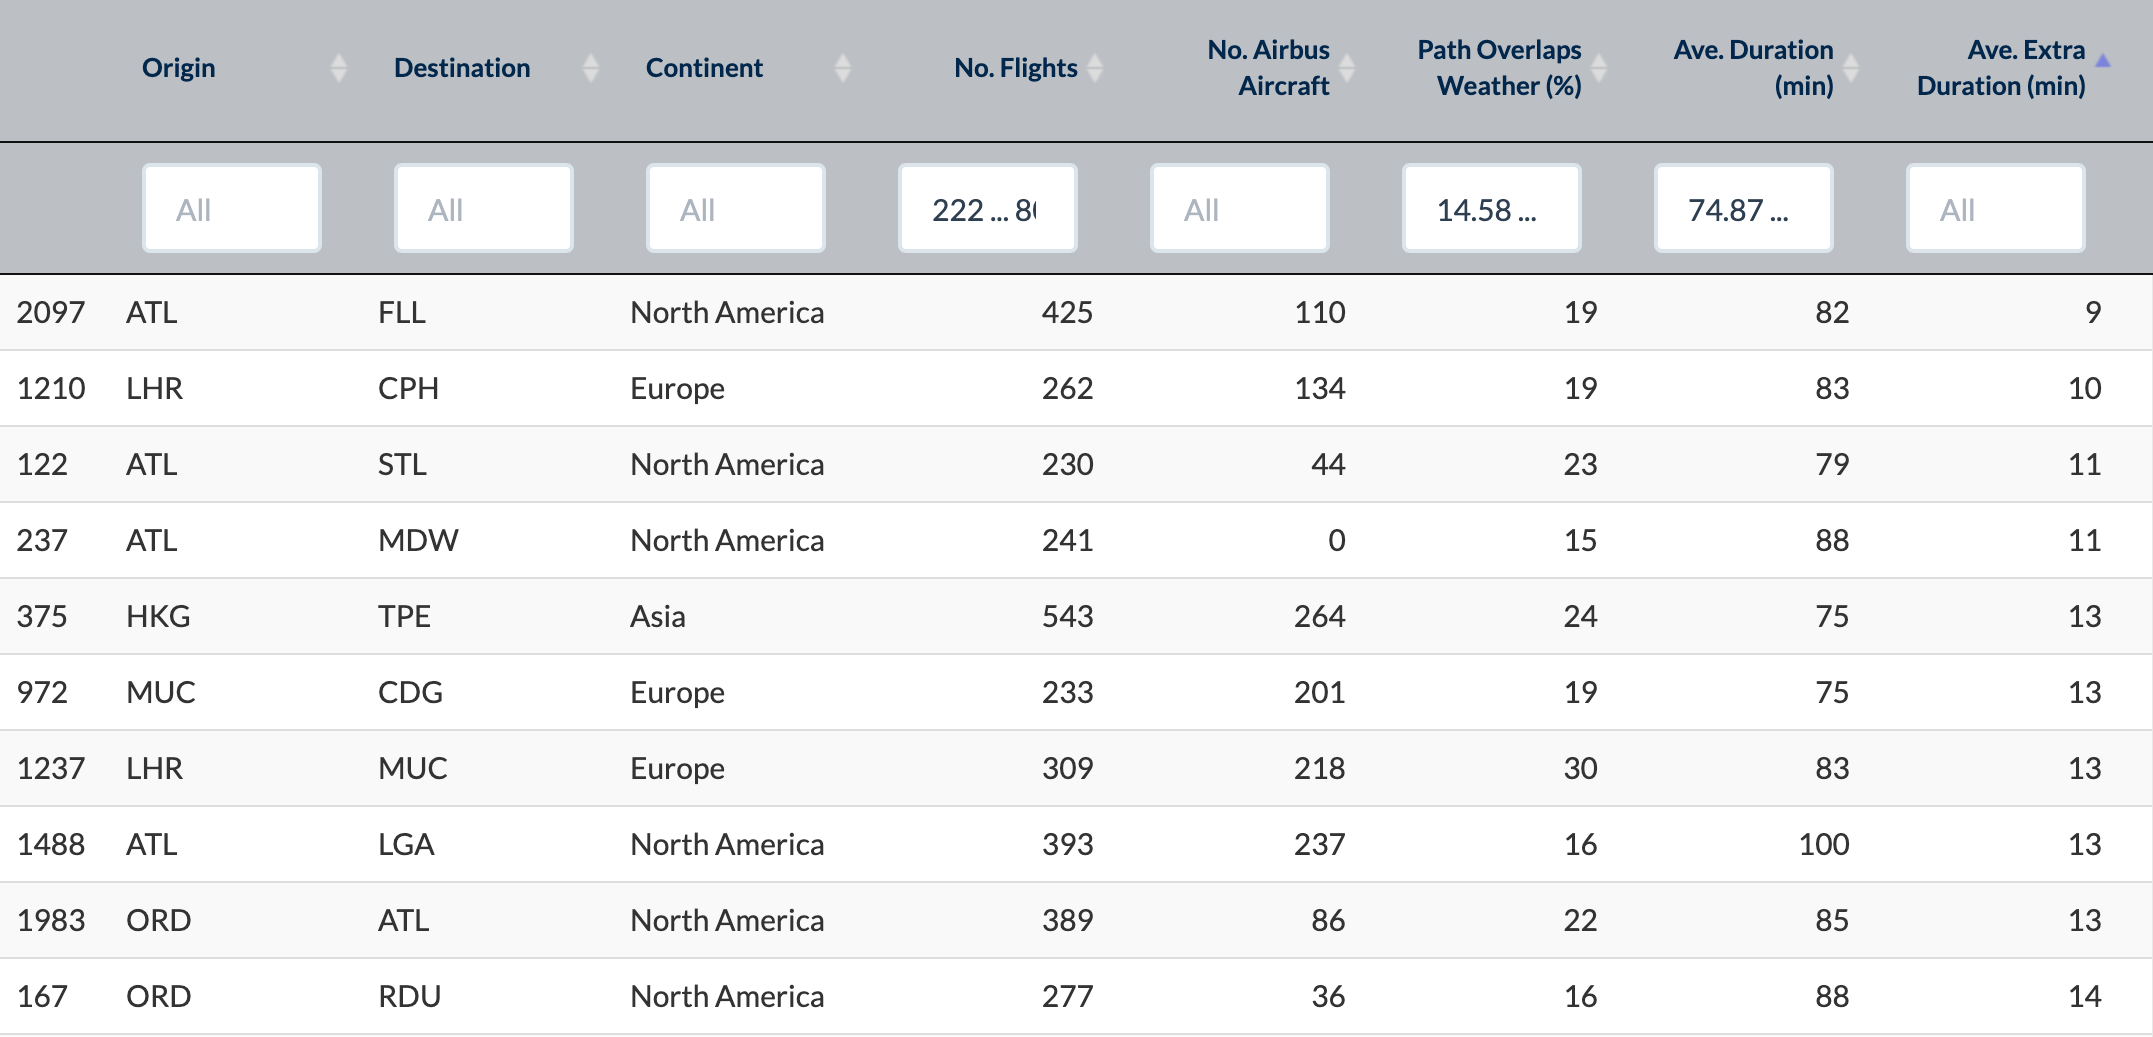
Project Monark had an idea for a way to create better weather data using sensors on Airbus's aircraft. They needed to justify the cost of this project by showing that better weather data would save money in the long term. This flight path explorer tool gave a way for Airbus employees to see the proportion of flights affected by weather on different routes, as well as the extent and cost of flight path variations that may have been avoidable if better in-flight weather data existed.
We used entirely open-source data for this project, including data from OpenSky, SIGMET reports from the Aviation Weather Center, storm events from the National Climatic Data Center, and flight delay data from the Bureau of Transportation Statistics. A huge portion of the project was to scrape, parse, and combine the data sources in order to get the data in a usable format. There was considerable effort to get OpenSky's snapshots of all the aircraft in the sky to a geographic Linestring format, and to pull useful data out of SIGMET text data and arrange in a table format.
Aircraft and weather data are notoriously sources of "big data", so I made many updates to ensure scripts would run quickly and consolidate data. In the end, the cleaned data is about 2% of the size of the original raw data. Then data sources were combined through a combination of aircraft ID, and time and location matching (after timezone and map projection transformation).
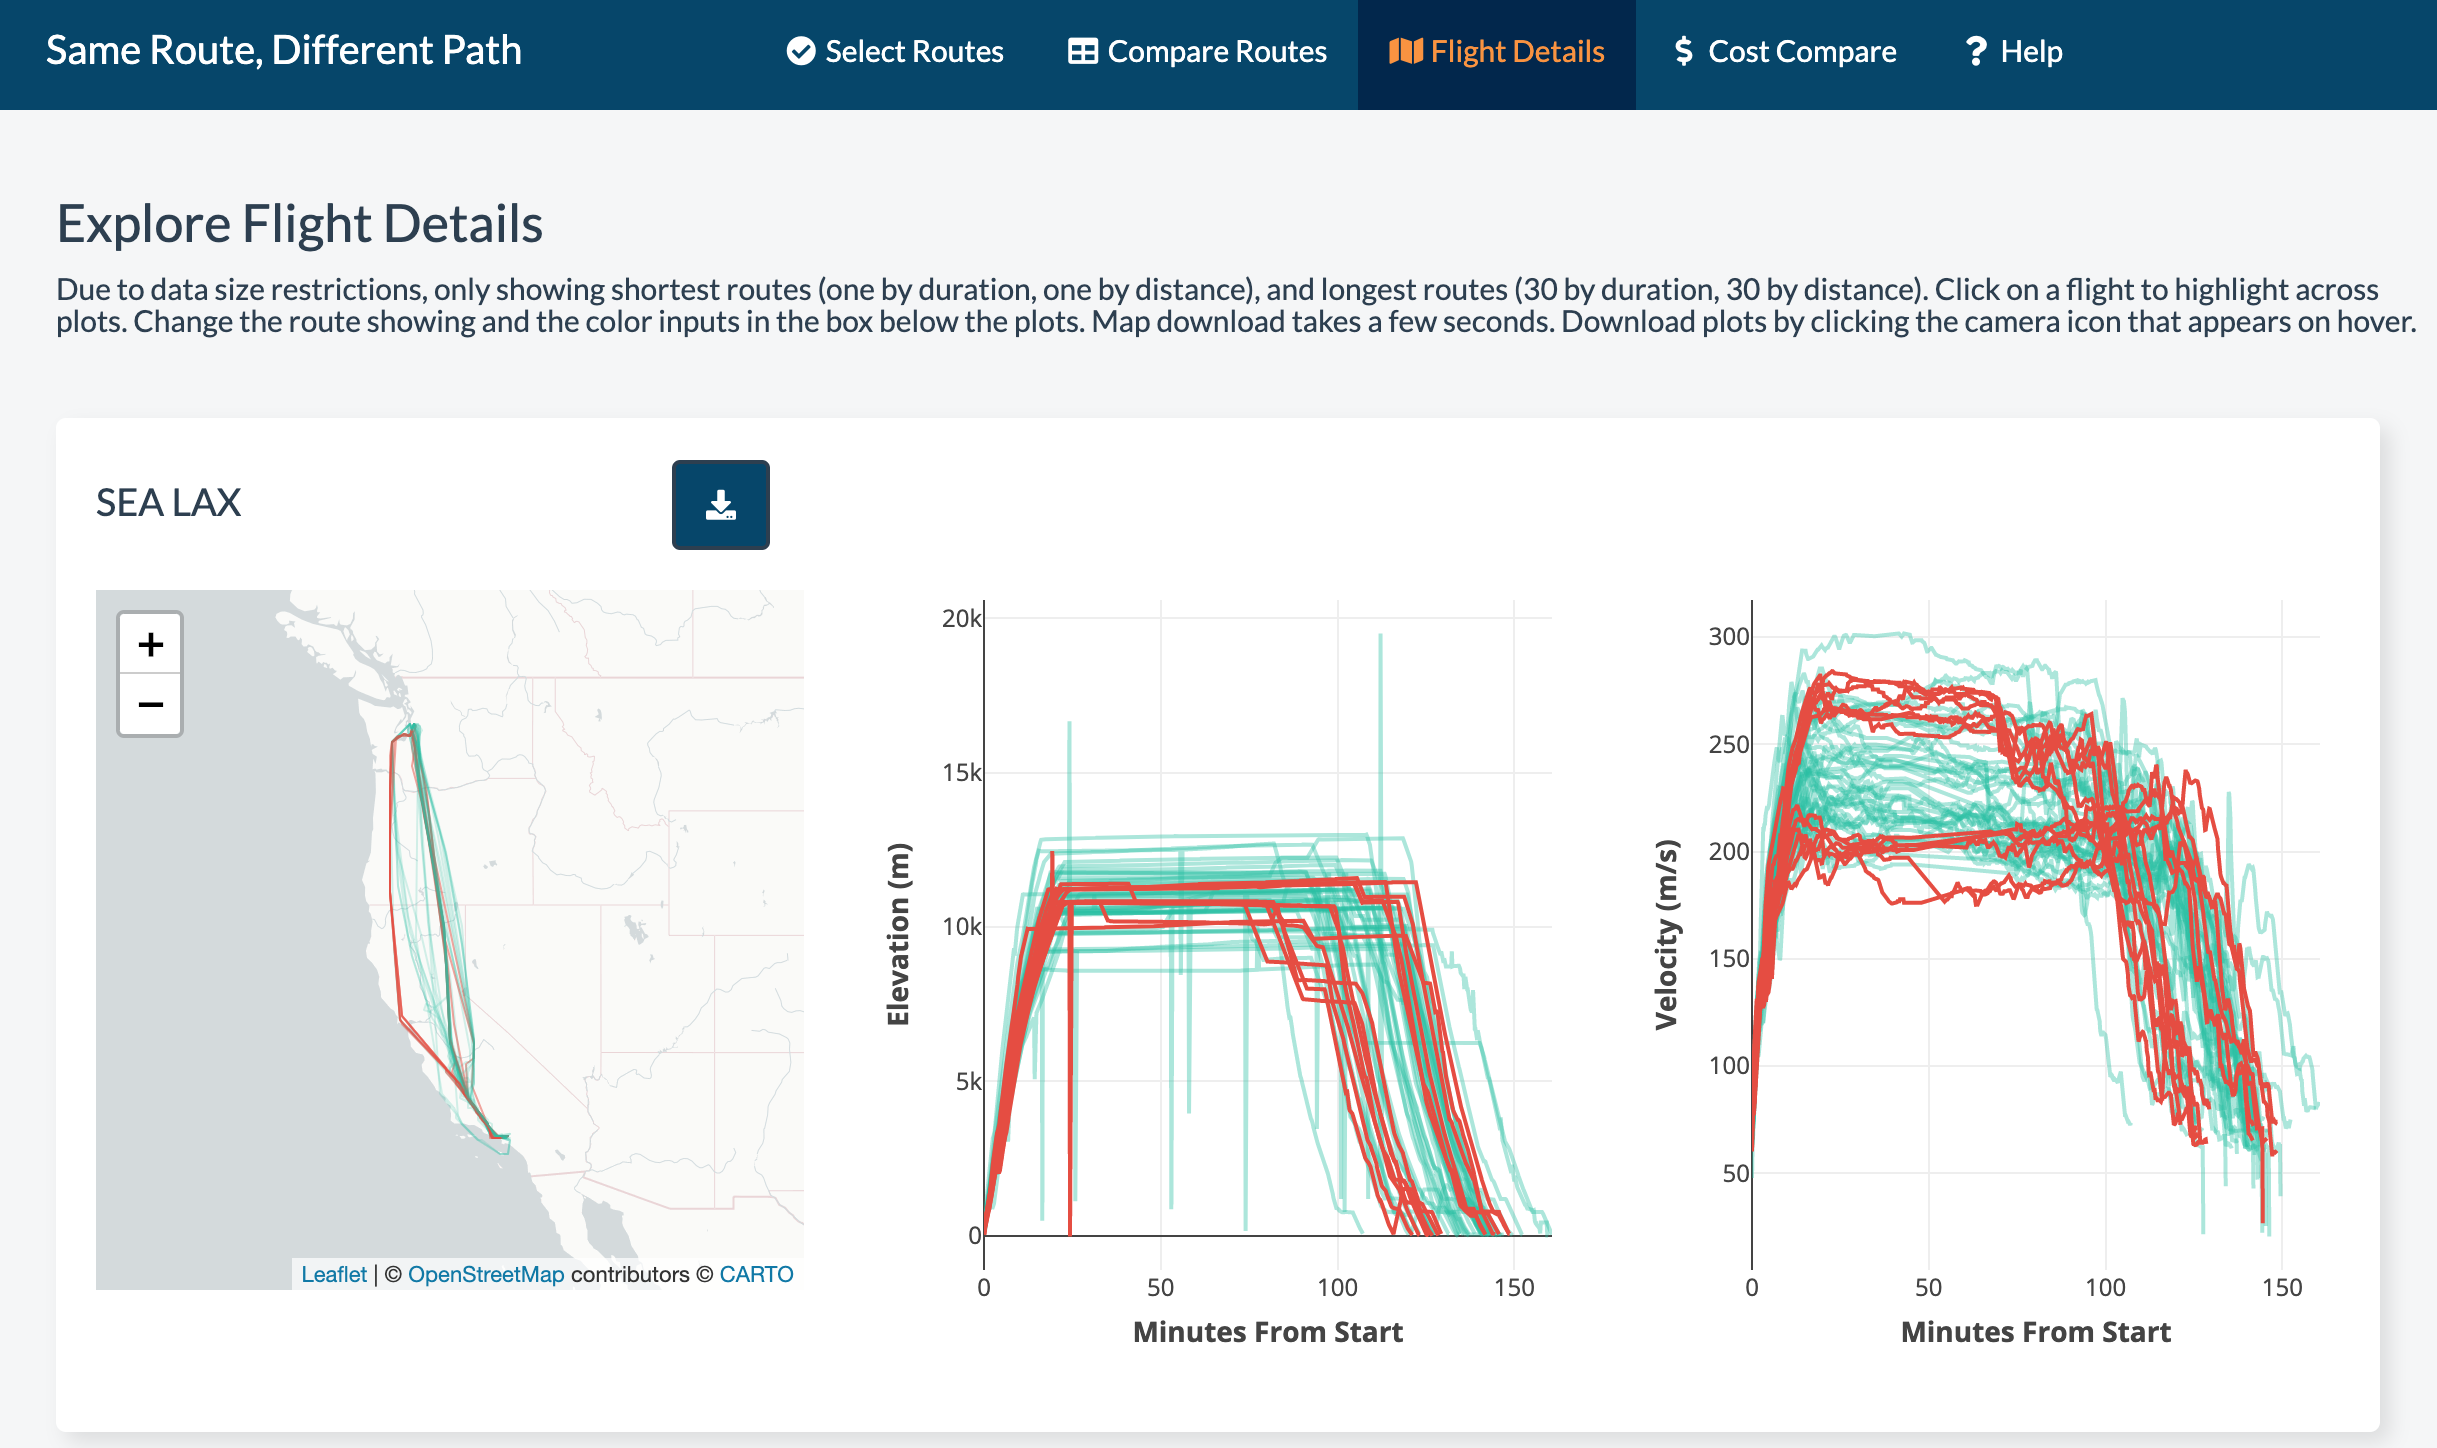
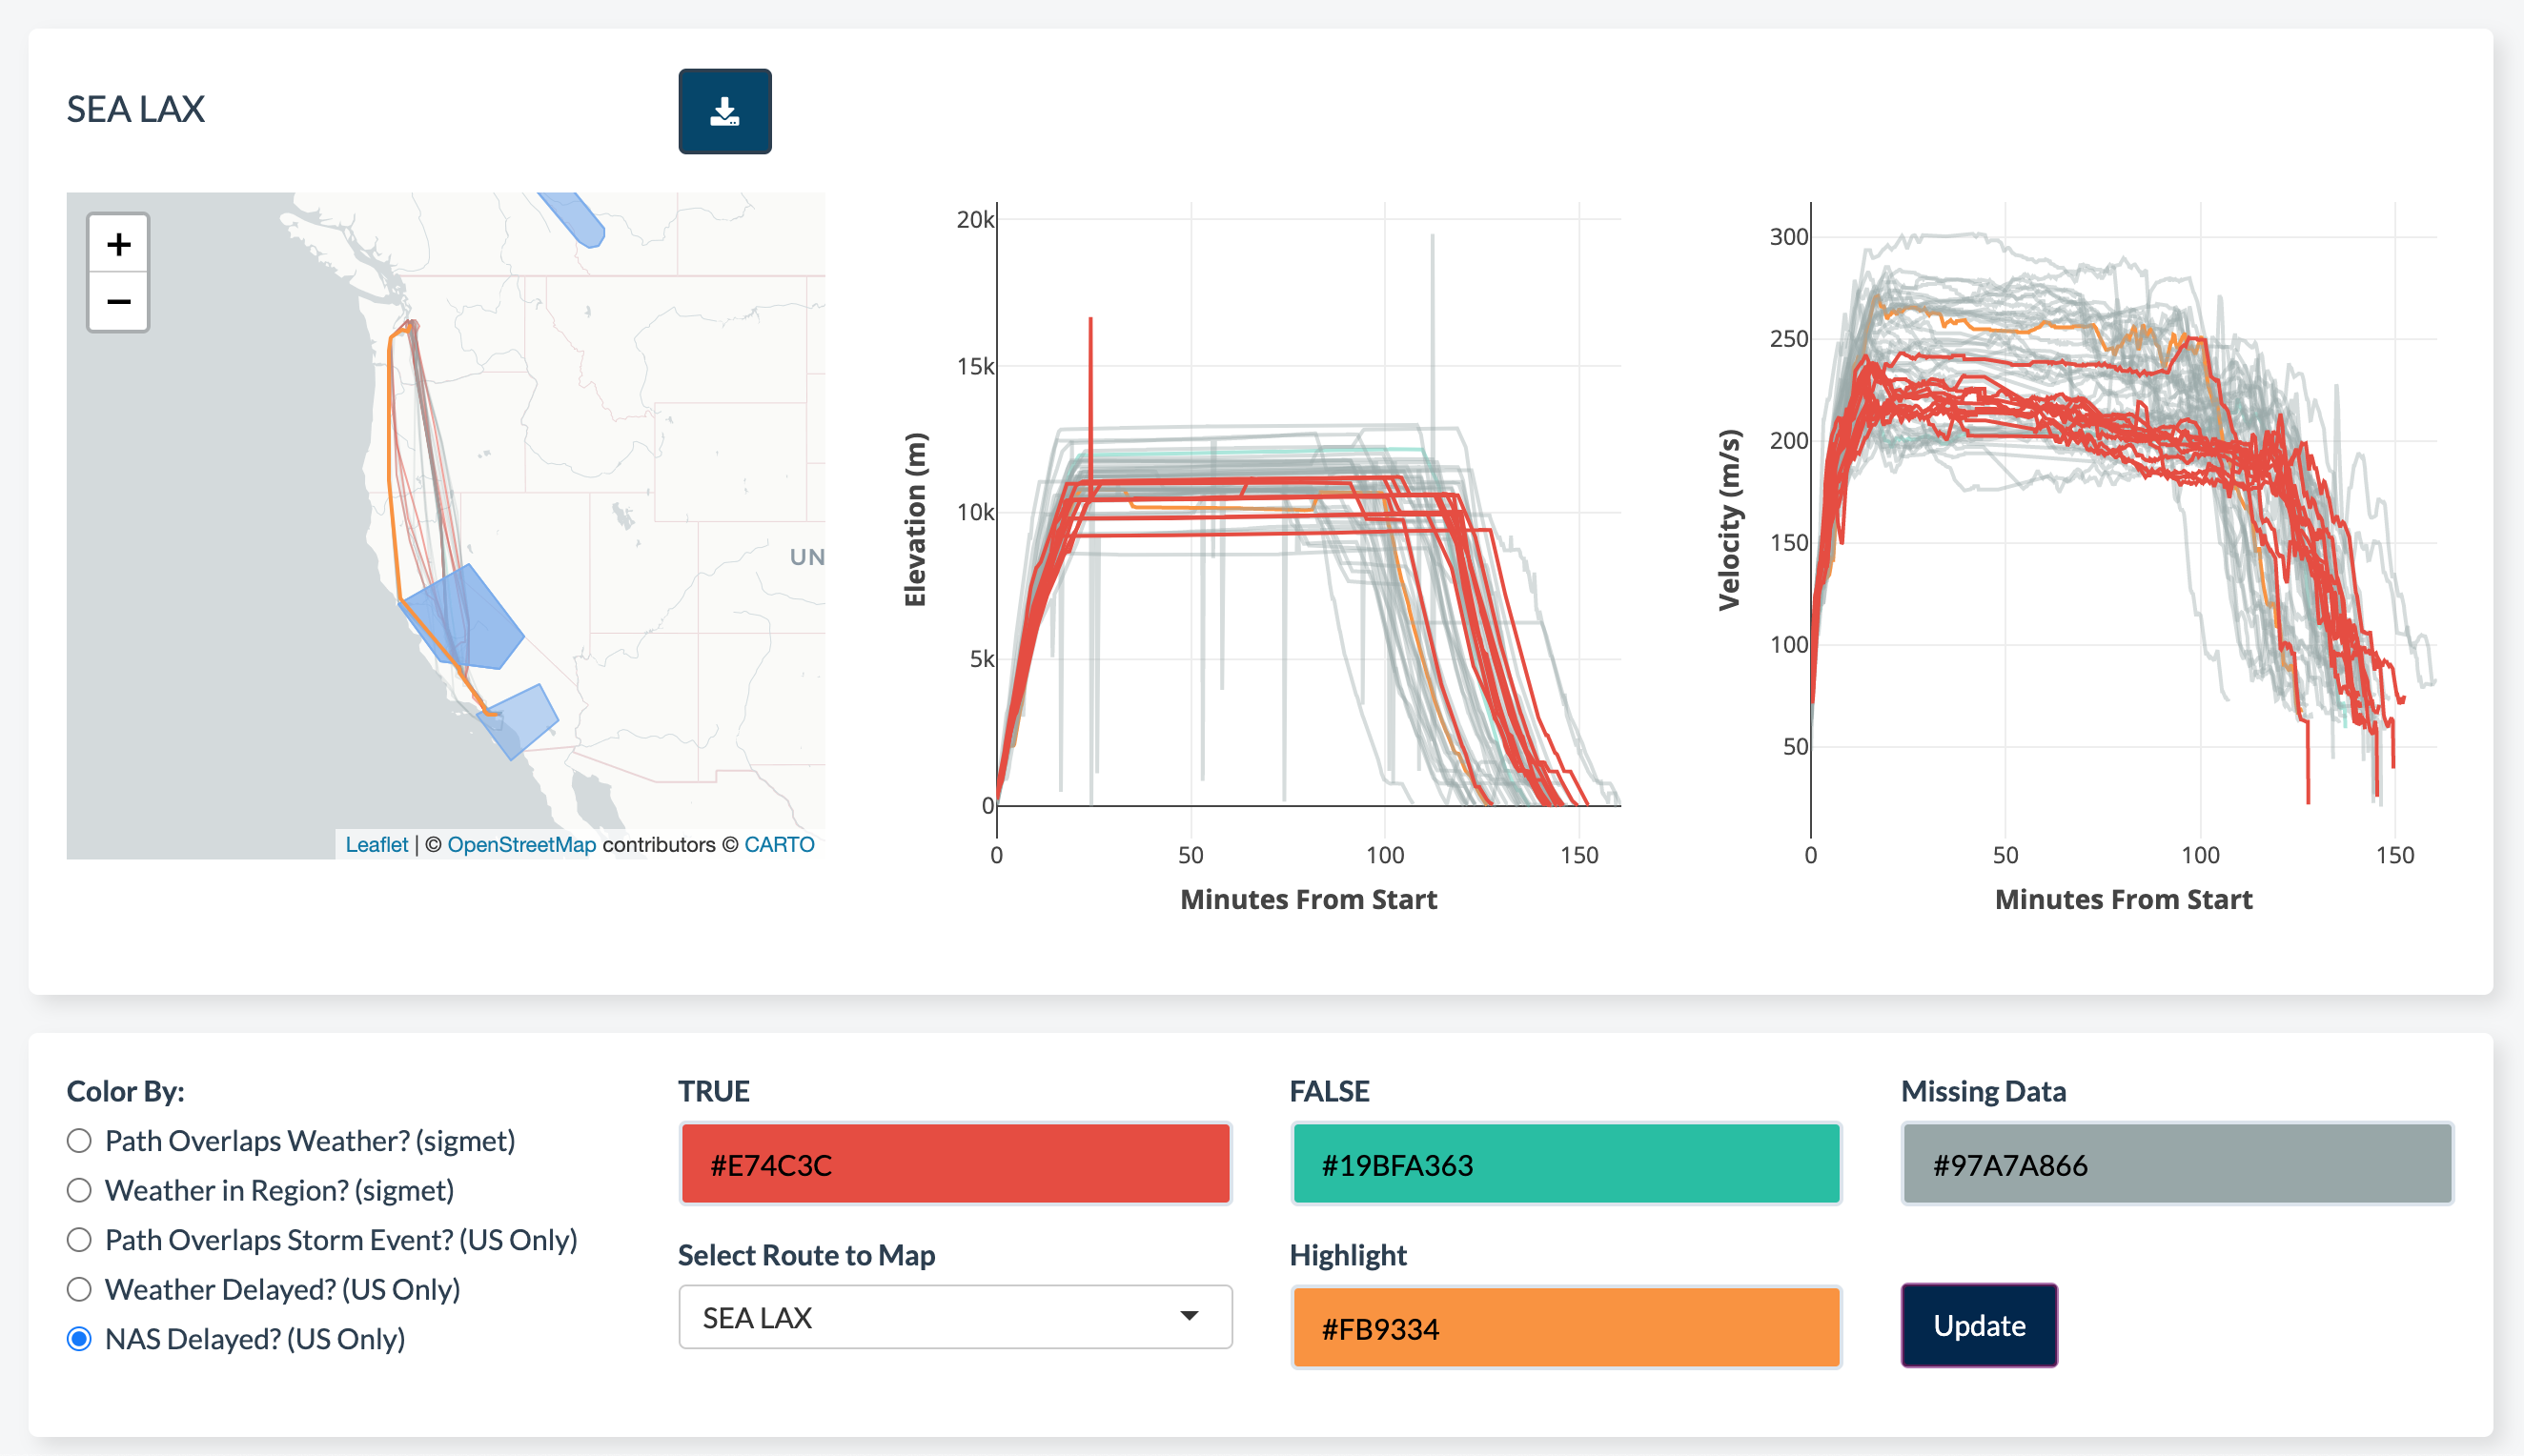
I worked with Leaflet and Plotly inside R Shiny in order to create maps and charts that were interactive. Users can zoom in and out, download plots, and highlight routes across routes. On click, associated SIGMETs will also show up on the map. During the data parsing process, SIGMET IDs which overlap the path were recorded. This also required a custom indexing scheme as Leaflet and Plotly have individual systems of assigning IDs to lines. In this image, we can see flightpaths parsed from OpenSky, weather (blue polygons) from SIGMET reports, and colors of the paths from delay data.
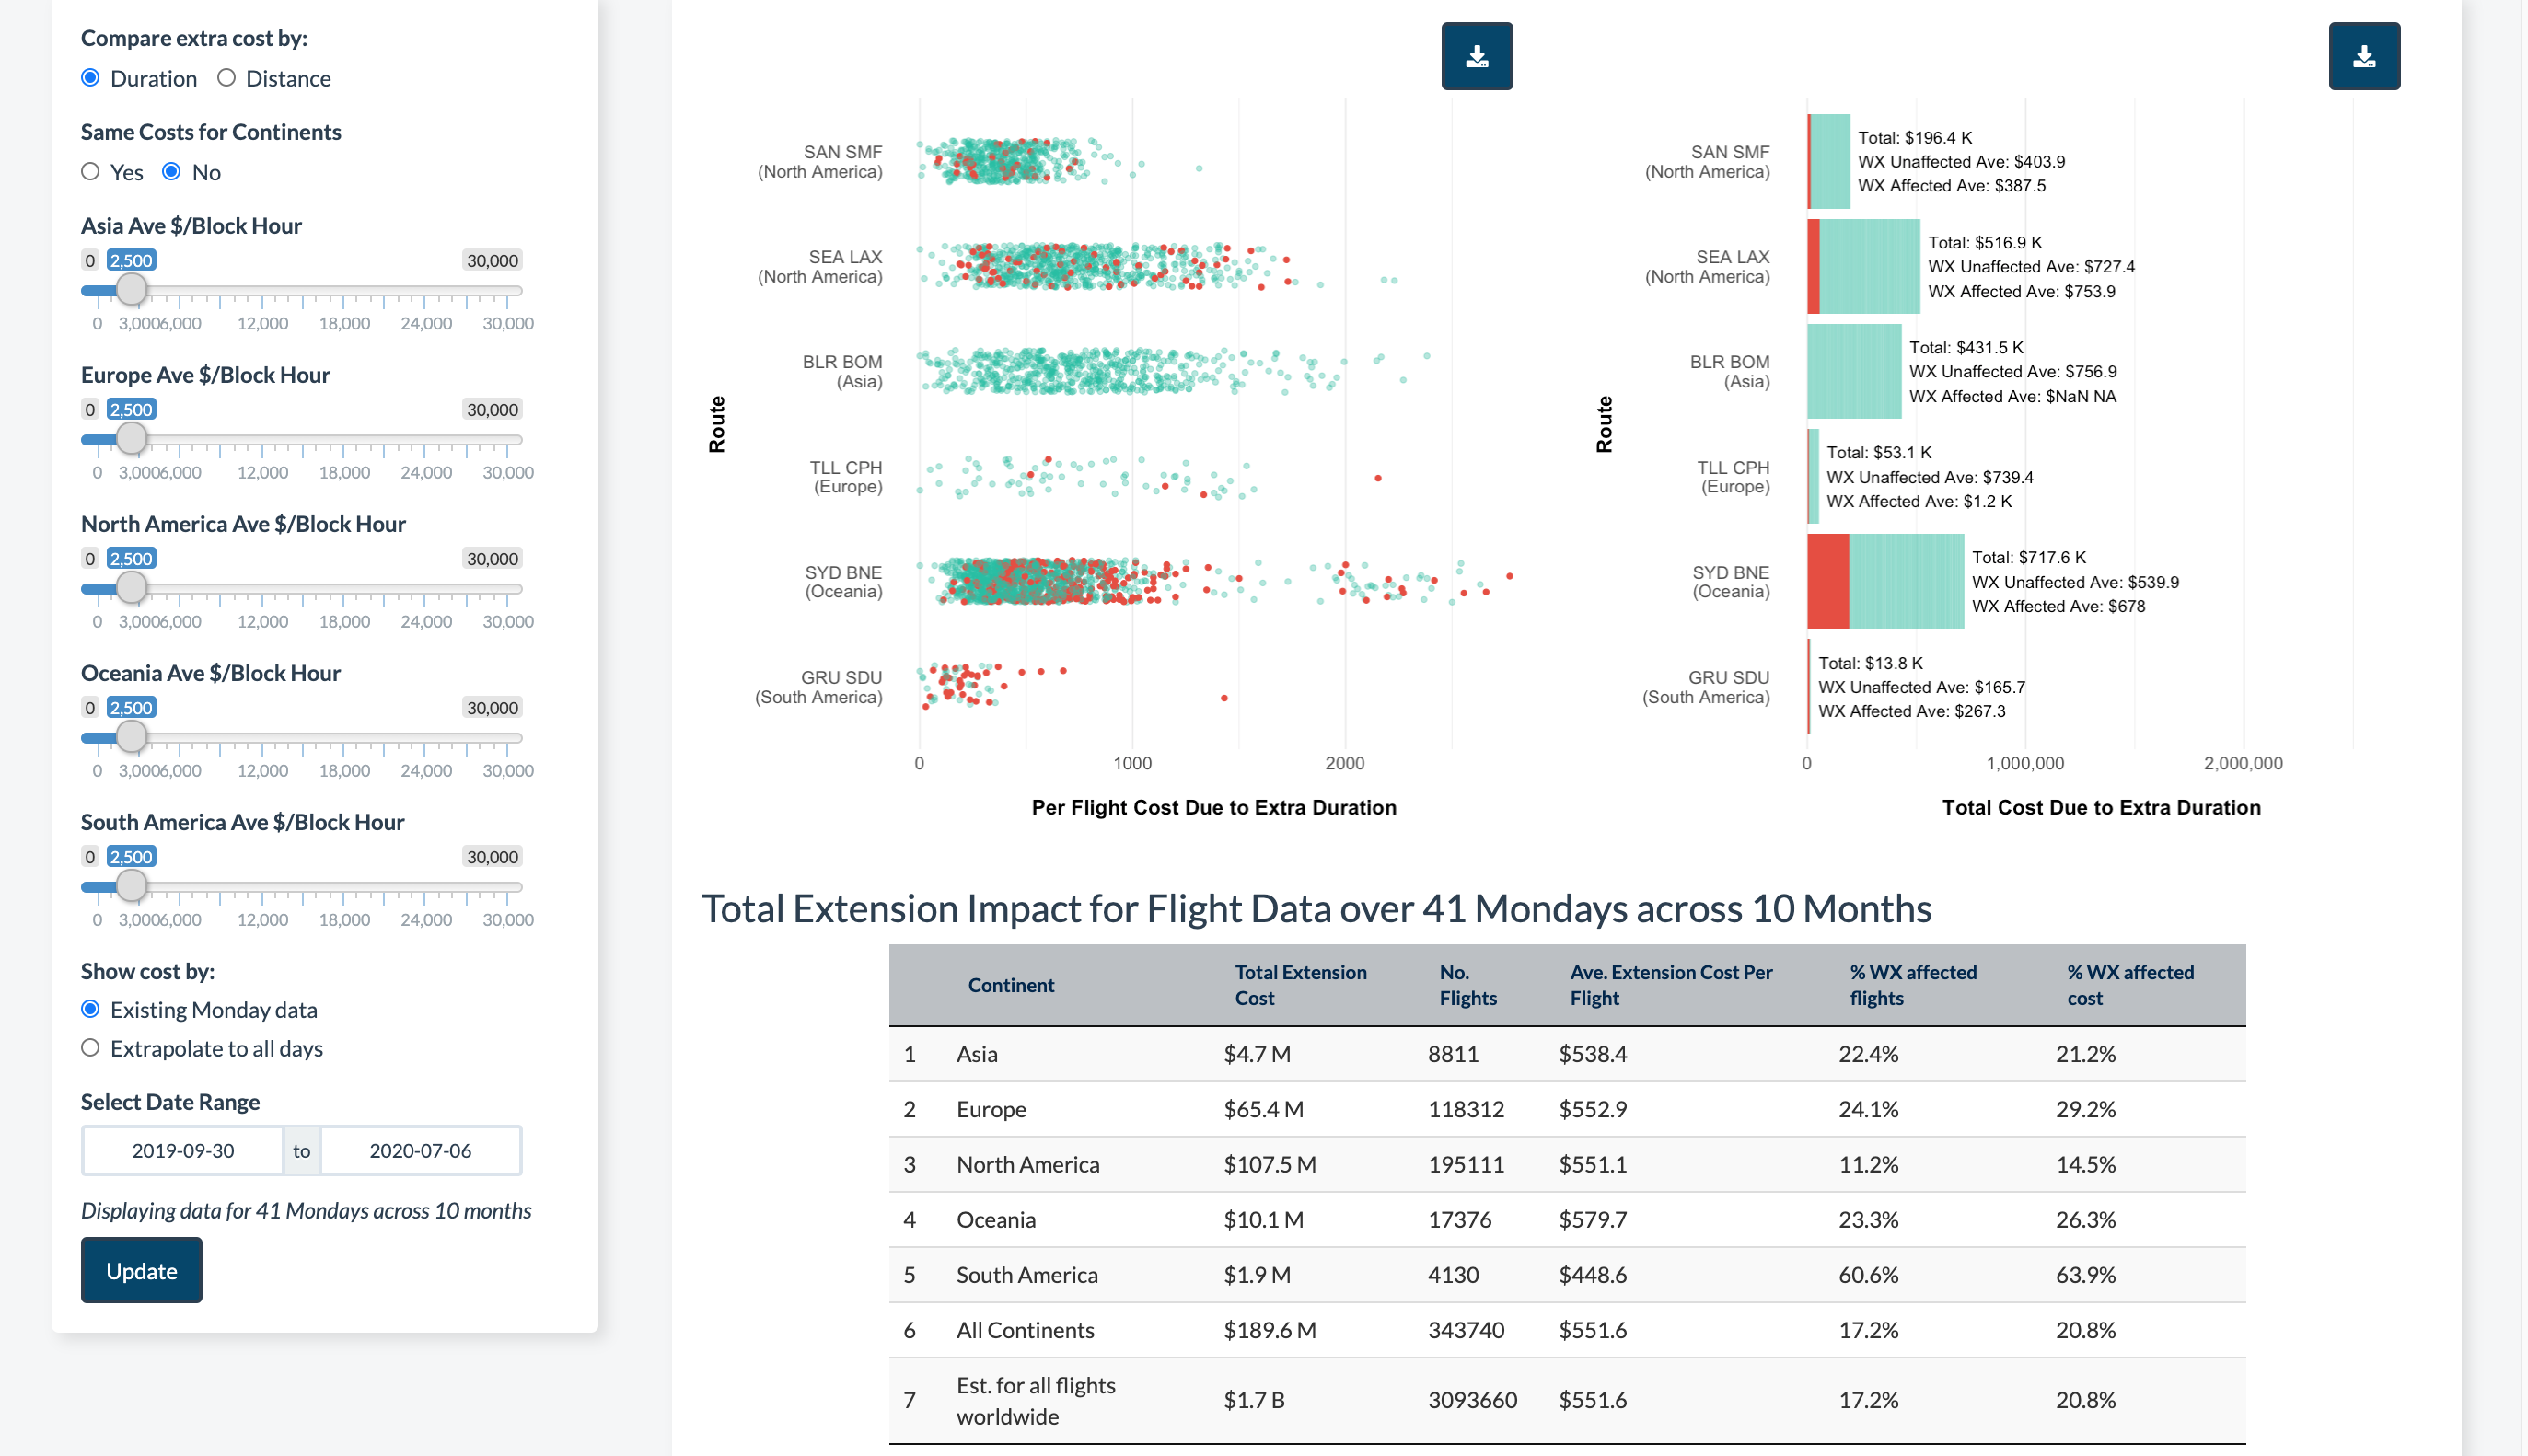
Since we on the project didn't want to assume how much it costs to operate an aircraft, we left it up to users to input how much an extra hour or extra kilometer of flight would cost. We also allowed users to input different costs for different continents. I kept track of the updated costs reactively in order to reflect the costs on other tabs as well.
The data and the parsing scripts can be found on Github. It is under an MIT licence, so any part of the code can be reused and repurposed. I hope the data parsing functions in particular will be helpful to other data scientists. A working version of the app is on shinyapps.io. On the last tab, there is a tutorial video which outlines every feature of the app.